A decade of price data, a modified RSI sitting at 33, and a macro support line that has survived every significant crash since 2014. This is the current state of XRP’s price action, and according to a technical outlook, the cryptocurrency is now moving around at the exact geometric coordinate where its most explosive historical rallies were born.
XRP Returns To An Oversold Zone
According to a technical analysis from a crypto analyst that goes by the name Cryptollica on the social media platform X, XRP’s long-term 10-day candlestick chart and a modified RSI reading now appear to be trading at levels seen in previous macro turning points.
The historical readings are precise. In 2017, the RSI bottomed at 37 before XRP’s legendary surge. In 2020, it reached 34 ahead of the bull run that carried the cryptocurrency to a multi-year high. In 2022, it fell to 31 during the broader crypto bear market. In 2024, the same RSI was at 36 during the correction low. Today, in March 2026, the RSI reads 33, which is directly inside that same red oversold zone that has preceded every major expansion cycle on record.

The reason why the RSI indicator is now showing oversold is that the XRP price has spent so long moving sideways and grinding lower in sentiment that many holders have become worn down by time more than by the price downtrend itself. But according to the analyst, the oversold level means that the downward momentum is now completely dead.
The Psychological Trap
The most interesting part of the post may be the psychological angle behind it. Cryptollica described XRP as an asset that wears holders down through delay. This is unlike altcoins like Solana and Dogecoin, which break investor conviction through sudden price drops. XRP, on the other hand, plays out its corrections through long periods of flat, draining price action that make conviction harder to maintain.
According to the analyst, there are two types of XRP investors: those who will endure the torture of time to capture the asymmetric expansion, and those who will be exhausted by the waiting and surrender their positions because of the sideways action.
Interestingly, the analyst also pointed to how the altcoin is currently trading above a rising green support line that stretches back to 2014 and has acted as a catch zone across different bear markets. Since 2014, this has been the macro bedrock that has caught every single devastating crash (early 2017, 2020 Covid, and 2022 bear).
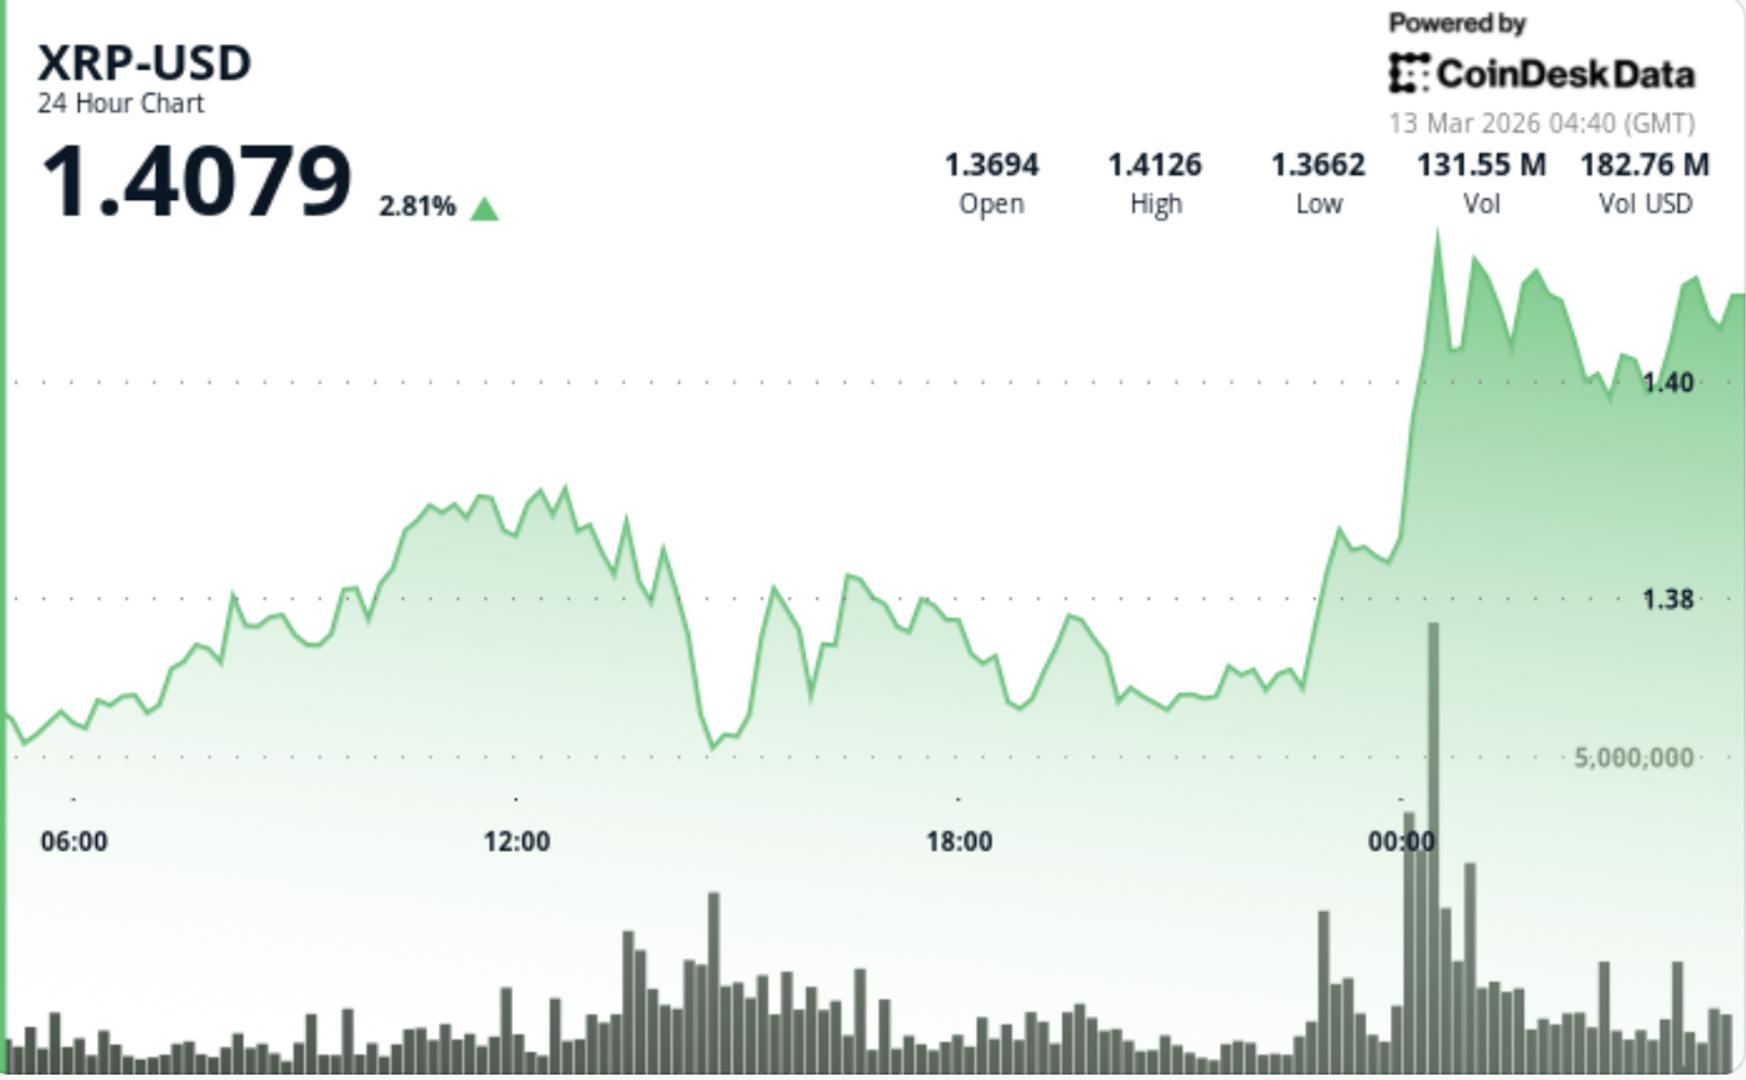
If past cycles are anything to go by, the token could continue forming higher lows on the 10-day timeframe, which would translate to a gradual climb into higher price ranges over the coming weeks and months. At the time of writing, XRP is trading at $1.37.


 English (US) ·