XRP price started a recovery wave above $1.350 but failed near $1.390. The price is now consolidating and might aim for a fresh move above $1.40.
- XRP price started a recovery wave above the $1.3750 zone.
- The price is now trading above $1.3720 and the 100-hourly Simple Moving Average.
- There is a bullish trend line forming with support at $1.3705 on the hourly chart of the XRP/USD pair (data source from Kraken).
- The pair could continue to move up if it settles above $1.40.
XRP Price Faces Resistance
XRP price remained supported above $1.3220 and started a recovery wave, like Bitcoin and Ethereum. The price was able to climb above $1.3350 and $1.350 to enter a short-term positive zone.
There was also a move above the 23.6% Fib retracement level of the downward move from the $1.4739 swing high to the $1.3217 low. Besides, there is a bullish trend line forming with support at $1.3705 on the hourly chart of the XRP/USD pair.
The bulls even pushed the price above $1.3850 but they struggled to keep the price above $1.3800. The price is now trading above $1.370 and the 100-hourly Simple Moving Average. If there is a fresh upward move, the price might face resistance near the $1.3880 level.
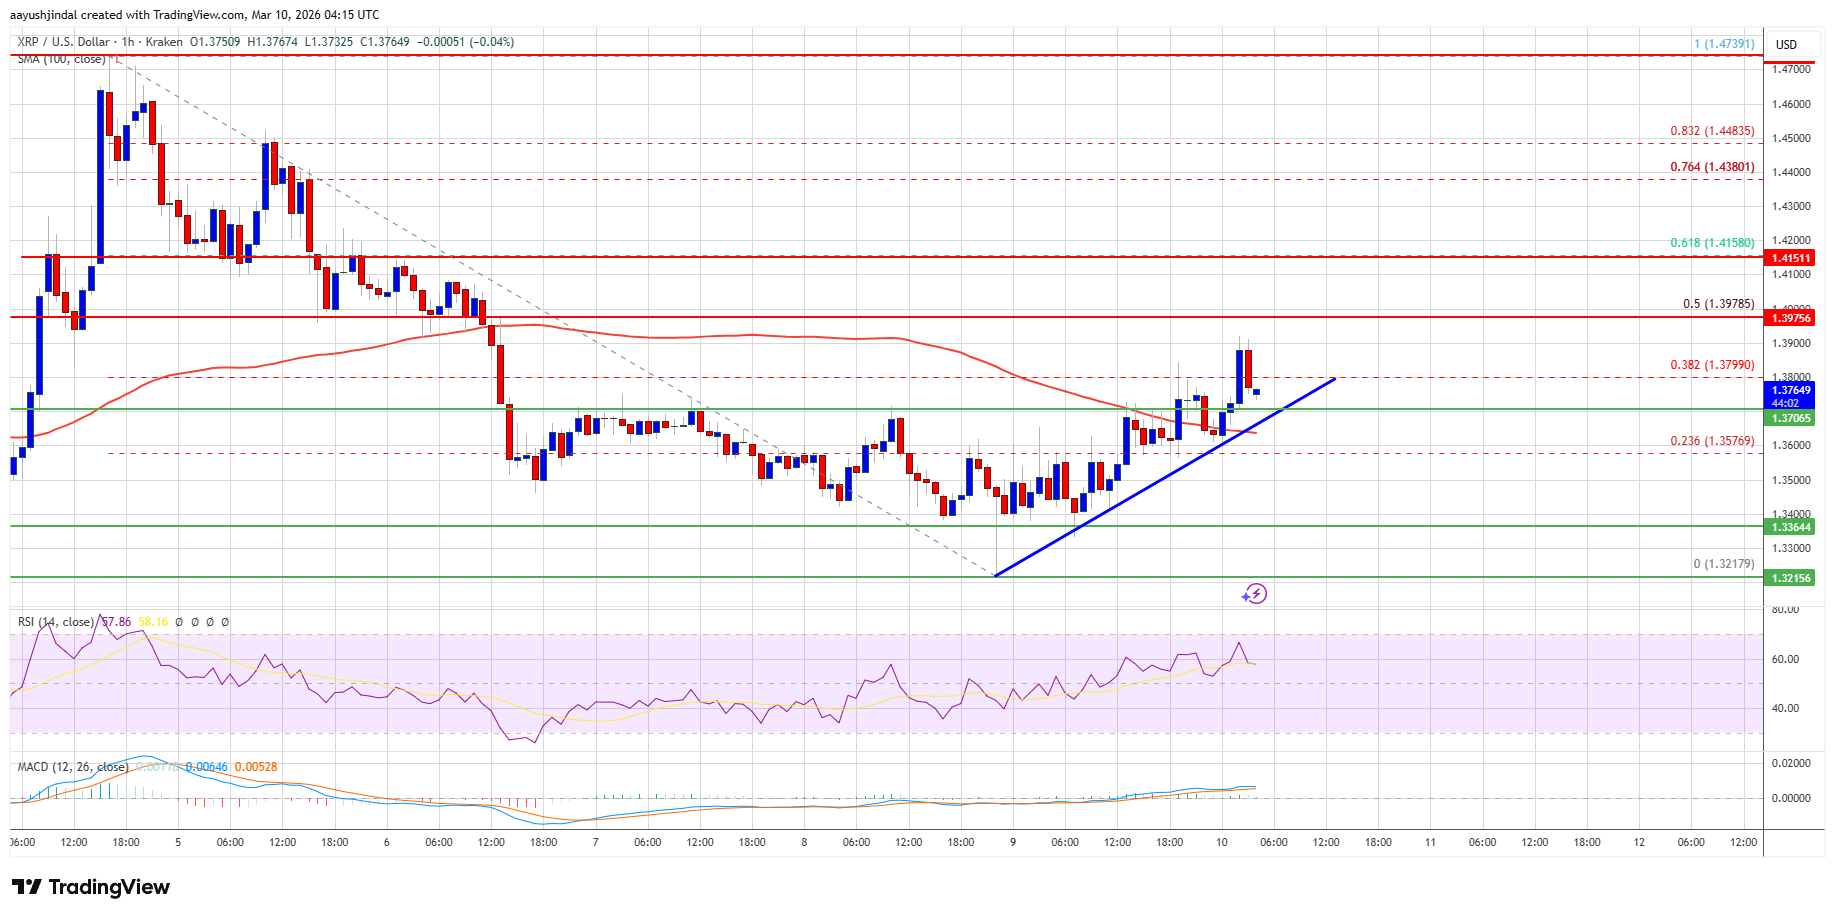
The first major resistance is near the $1.3980 level or the 50% Fib retracement level of the downward move from the $1.4739 swing high to the $1.3217 low. A close above $1.3980 could send the price to $1.4120. The next hurdle sits at $1.420. A clear move above the $1.420 resistance might send the price toward the $1.450 resistance. Any more gains might send the price toward the $1.4650 resistance.
Another Drop?
If XRP fails to clear the $1.3980 resistance zone, it could start a fresh decline. Initial support on the downside is near the $1.370 level and the trend line. The next major support is near the $1.350 level.
If there is a downside break and a close below the $1.350 level, the price might continue to decline toward $1.3360. The next major support sits near the $1.3220 zone, below which the price could continue lower toward $1.3050.
Technical Indicators
Hourly MACD – The MACD for XRP/USD is now losing pace in the bullish zone.
Hourly RSI (Relative Strength Index) – The RSI for XRP/USD is now above the 50 level.
Major Support Levels – $1.3700 and $1.3500.
Major Resistance Levels – $1.3980 and $1.4120.


 English (US) ·