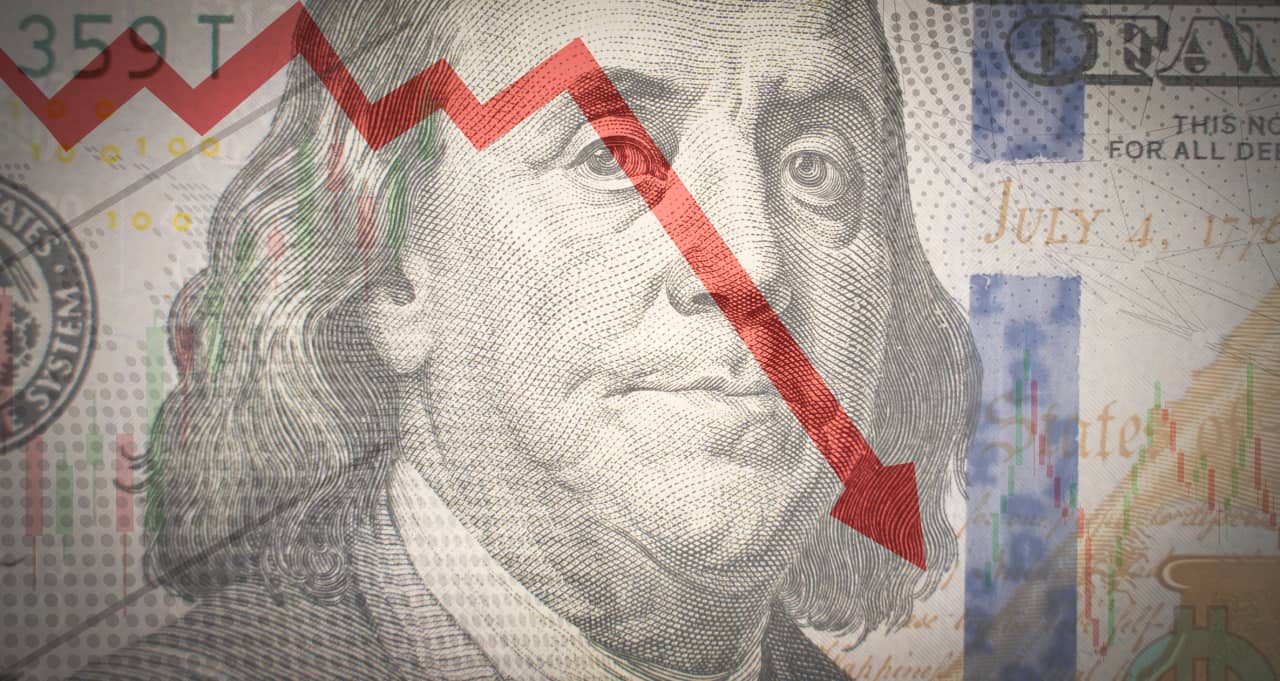
XRP Breaks $2.80 as Bearish September Begins, Oversold Signals Suggest Recovery Ahead
5 months ago
238
News Background
XRP declined 4% from $2.85 to $2.75 in the 24-hour session ending Sept. 1 at 02:00, moving across a $0.12 (4%) range.
Market turbulence was amplified by institutional liquidation flows totaling $1.9B since July, prompting fears of cyclical exhaustion.
In contrast, whales accumulated 340M XRP over the past two weeks, highlighting contradictory behavior between large holders and short-term liquidators.
September seasonality and ongoing regulatory pressure in the U.S. add to caution: crypto markets have historically underperformed in September, while unresolved SEC actions keep institutions wary.
On-chain data shows activity on the XRP Ledger trending higher, with symmetrical-triangle formations reminiscent of 2017 pre-breakout conditions. Liquidity maps suggest concentrations up to $4.00 that could amplify any upside move.
Price Action Summary
The sharpest decline came at 23:00 GMT on Aug. 31, when XRP dropped from $2.80 to $2.77 on 76.87M volume, nearly triple the daily average of 27.3M.
Support was tested again during the final hour (01:31–02:30 GMT, Sept. 1) as price fell from $2.77 to $2.75, with spikes of 10M+ tokens per minute confirming forced liquidations.
Earlier in the day, XRP briefly touched $2.87 before retreating, as institutional selling capped rallies above $2.80.
Technical Analysis
Support: $2.75–$2.77 remains the immediate base; below this, $2.50 and $2.00 are critical longer-term levels.
Resistance: Heavy rejection at $2.80–$2.87 marks the ceiling for now; $3.30 is the higher-term breakout line.
Momentum: RSI dipped into the mid-40s before stabilizing, suggesting oversold conditions.
MACD: Bearish divergence persists but histogram compression points to potential crossover if accumulation continues.
Patterns: Symmetrical triangle + double-bottom formations align with long-term cup-and-handle structure. Analysts flag upside potential to $5–$13 if resistance breaks and liquidity pockets above $4.00 are tapped.
Volume: The 76.87M spike during the $2.80 breakdown confirms distribution, but whale absorption of 340M tokens in the background supports the case for accumulation.
What Traders Are Watching
Can $2.75 hold as the new floor into early September trading?
A close above $2.87 would flip bias toward a run at $3.30.
Divergence between institutional selling ($1.9B since July) and whale accumulation (340M tokens in August) as a key market driver.
Whether seasonal September weakness overrides bullish structural setups pointing to $5–$13.


 English (US) ·