Bitcoin price started a steady increase above $70,000 and $72,000. BTC is now consolidating and might aim for more gains above $72,800.
- Bitcoin started a fresh increase after it settled above the $68,800 support.
- The price is trading above $70,000 and the 100 hourly simple moving average.
- There is a bullish trend line forming with support at $68,000 on the hourly chart of the BTC/USD pair (data feed from Kraken).
- The pair might dip again if it trades below the $72,000 and $70,800 levels.
Bitcoin Price Rallies Above $70,000
Bitcoin price managed to form a base above the $67,500 zone. BTC started a fresh increase and was able to surpass the $68,800 resistance zone.
The price even rallied above the $70,000 resistance. Finally, the bears appeared near $74,000. A high was formed at $74,062, and the price recently corrected some gains. There was a move below $73,000, and the price declined toward the 23.6% Fib retracement level of the upward move from the $66,164 swing low to the $74,062 high.
Bitcoin is now trading above $70,000 and the 100 hourly simple moving average. There is also a bullish trend line forming with support at $68,000 on the hourly chart of the BTC/USD pair.
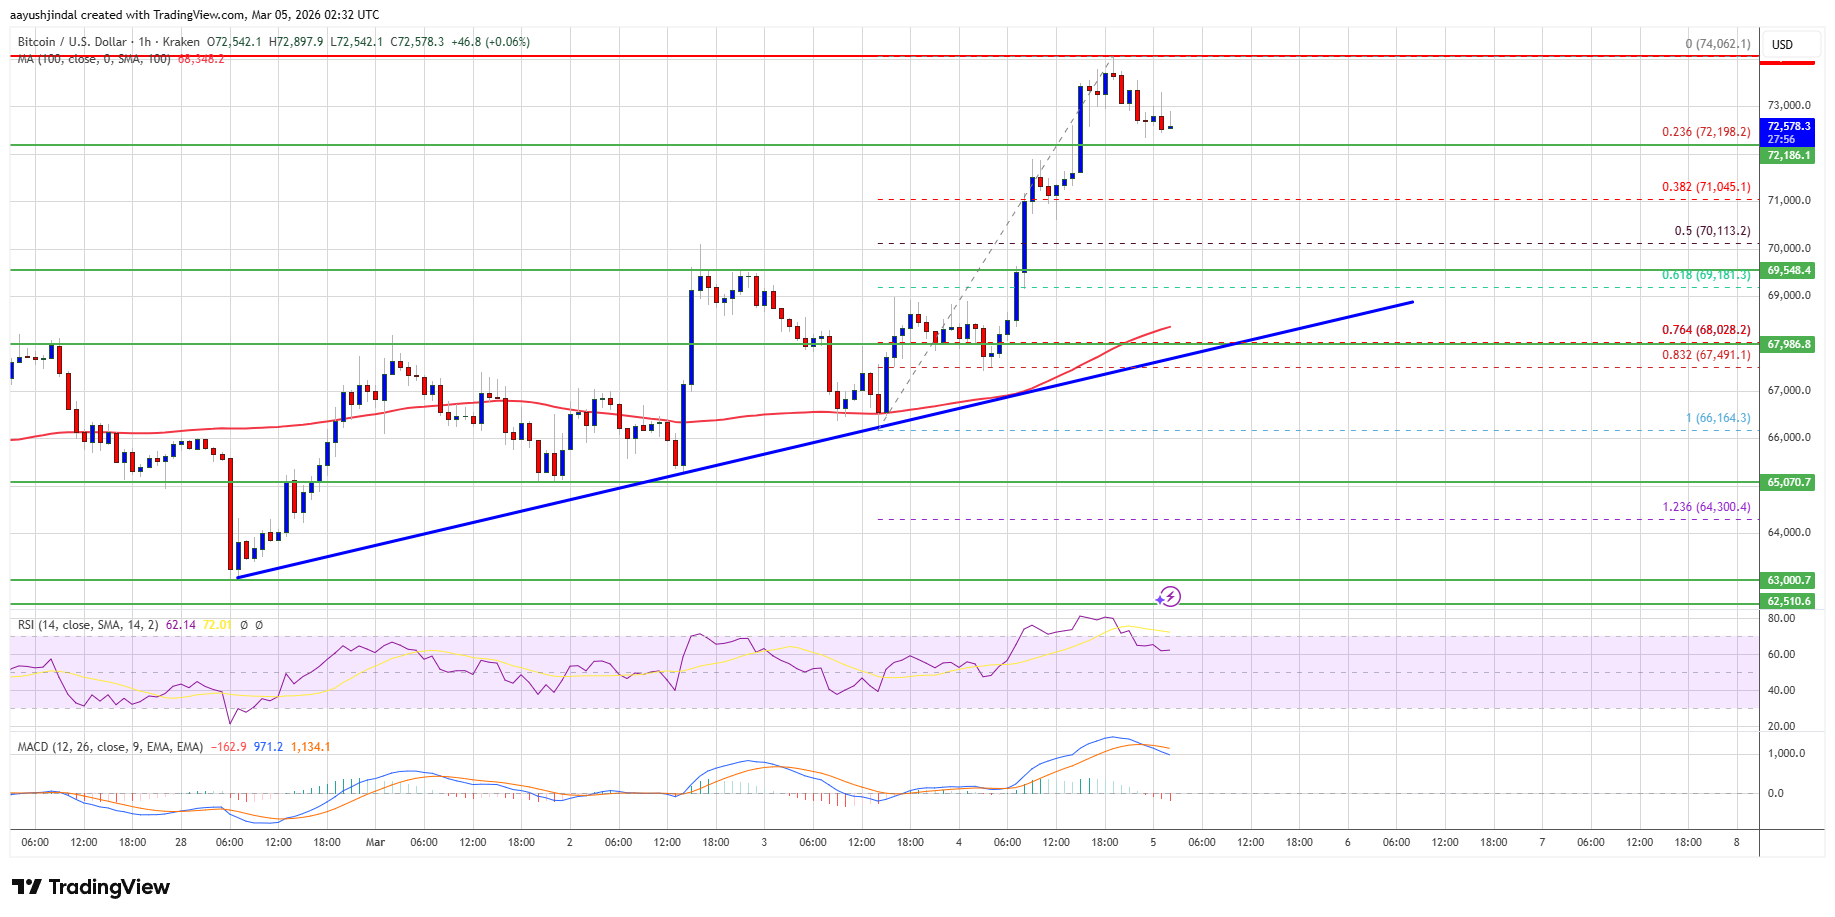
If the price remains stable above $70,000, it could attempt a fresh increase. Immediate resistance is near the $72,800 level. The first key resistance is near the $73,500 level. A close above the $73,500 resistance might send the price further higher. In the stated case, the price could rise and test the $74,000 resistance. Any more gains might send the price toward the $75,000 level. The next barrier for the bulls could be $76,800 and $77,200.
Downside Correction In BTC?
If Bitcoin fails to rise above the $72,800 resistance zone, it could start another decline. Immediate support is near the $72,200 level. The first major support is near the $72,000 level.
The next support is now near the $70,000 zone or the 50% Fib retracement level of the upward move from the $66,164 swing low to the $74,062 high. Any more losses might send the price toward the $68,800 support in the near term. The main support now sits at $68,000, below which BTC might struggle to recover in the near term.
Technical indicators:
Hourly MACD – The MACD is now losing pace in the bullish zone.
Hourly RSI (Relative Strength Index) – The RSI for BTC/USD is now above the 50 level.
Major Support Levels – $72,000, followed by $70,000.
Major Resistance Levels – $72,800 and $73,500.


 English (US) ·